How to Build a Predictive Maintenance Strategy That Scales Across All Asset Classes

A scalable predictive maintenance strategy isn’t built on sensors, dashboards, or software - it’s built on engineering logic, failure physics, and an operating model that holds up across all asset types. Most PdM programs fail to scale, not because the technology is weak, but because the strategy is inconsistent, vendor-driven, or built around individual assets instead of a system-wide framework. When a PdM program follows clear decision rules, standardized workflows, and consistent detection capability, scale becomes a natural outcome.
Below is a practical, engineering-based framework for creating a predictive maintenance strategy that can scale across rotating equipment, electrical assets, hydraulics, conveyors, utilities, and more.
Why Predictive Maintenance Often Fails to Scale
PdM pilots typically start strong: a limited area, a few assets instrumented, and dashboards showing green or yellow conditions. But scaling across a full facility - or multiple facilities - breaks down quickly.
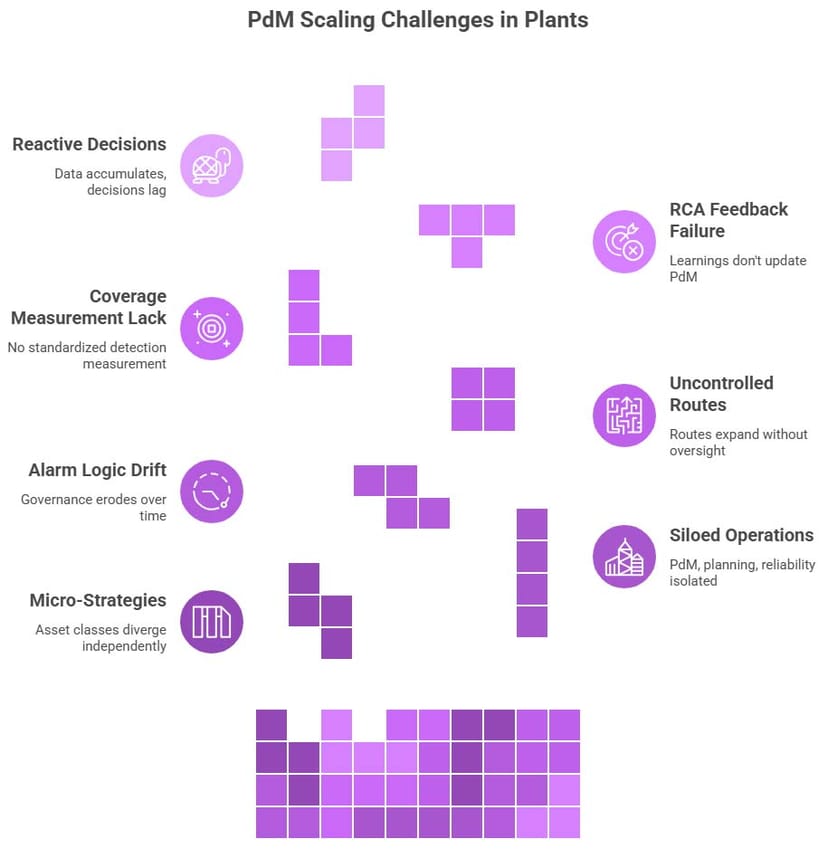
Common issues include:
Each asset class develops its own mini-strategy
PdM, planning, and reliability operate in silos
Alarm logic drifts without oversight
Routes grow uncontrollably
No consistent detection criteria
RCA findings don’t inform updates to PdM
Lots of data, but inconsistent decisions
Scalability requires one unified, physics-based approach - not many disconnected ones.
Principle 1: Start With Failure Modes, Not Technology
A scalable strategy begins with failure-mode analysis, not sensor selection.
Correct sequence:
Identify credible failure modes
Determine detectability based on failure physics
Select the PdM technique most sensitive to each failure mode
Set inspection frequency based on degradation rate
Standardize validation and decision criteria
Connect PdM findings to planning and scheduling
This approach works for any asset type because the logic is universal.
Principle 2: Build an Asset-Class Based Framework
Scaling is easier when assets are grouped by how they behave mechanically and electrically—not by OEM, department, or legacy system.
Rotating Equipment (motors, pumps, fans, blowers)
Failure modes: imbalance, misalignment, bearing fatigue, lubrication issues, electrical degradation
Techniques:
Vibration (primary)
Ultrasound (friction, lubrication quality, early bearing stress)
Motor Signature / Current Signature Analysis (energized)
Offline MCA (circuit analysis)
Thermography under load
Hydraulic Systems
Failure modes: particulate/water contamination, seal leakage, cavitation/aeration, valve drift, pump wear, thermal degradation, actuator wear
Techniques: fluid analysis, pressure trending, ultrasound, thermography
Gear-Driven Systems (gearboxes, reducers, drives)
Failure modes: gear mesh wear, lubrication starvation, overload, misalignment
Techniques: vibration, oil analysis (particle count, spectroscopy, viscosity), thermography
Electrical Equipment (panels, switchgear, MCCs)
Failure modes: loose connections, insulation breakdown, phase imbalance, overheating
Techniques: thermography (NFPA 70B, ASTM E1934, NETA MTS), ultrasound in electrical mode, MCSA
Conveyance Systems (belts, chains, pulleys, rollers)
Techniques: vibration, ultrasound, belt tension measurement, laser alignment, wear gauging, lubrication checks, impact monitoring
Asset-class frameworks prevent the chaos of customized PdM logic for every individual machine.
Principle 3: Standardize Detection Logic Across Techniques
Scaling PdM requires consistent interpretation rules across all technologies.
Vibration Analysis
Velocity RMS (10–1000 Hz) for general health, following ISO 10816/20816
High-frequency acceleration for early bearing defects
Displacement for low-speed, low-frequency problems
Envelope (demodulation) for repetitive impact events such as bearing defects, gear mesh anomalies, and cavitation
Phase analysis for misalignment and looseness
Acceptance testing during installation or rebuilds
Ultrasound
Trending dB levels against established baselines
Identifying friction, lack of lubrication, and impact signatures
Electrical inspection for corona, arcing, and tracking
Leak identification
Thermography
Thermal comparison under known load
Anomaly detection aligned with NFPA 70B (2023 Standard), ASTM E1934, and NETA MTS
Delta-T evaluation between similar components or phases
Motor Testing
Offline: insulation resistance, polarization index, surge testing
Online: MCSA for rotor bar issues, air-gap problems, turn-to-turn faults
A scalable strategy uses defined criteria for Trend, Warning, Alarm, and Critical, removing ambiguity from decision-making.
Principle 4: Base Inspection Frequency on Degradation Rate
Inspection frequency should reflect the speed of degradation and detection windows.
Important nuance:
Fixed frequencies (monthly, quarterly, annual) are valid when tied to operational cycles and justified by failure progression, not when chosen arbitrarily.
Key drivers include:
Failure mechanism speed
Portion of the P-F interval detectable by the technique
Equipment criticality
Environmental and load conditions
Clarifying the P-F Interval
The P-F interval is the time between when a failure becomes detectable (Potential Failure) and when the asset loses function (Functional Failure).
This interval can range from minutes to months, depending on the failure mode.
Inspection schedules must fit inside that window.
Principle 5: Use One Standard Workflow From Detection to Work Execution
A scalable PdM program relies on a consistent workflow:
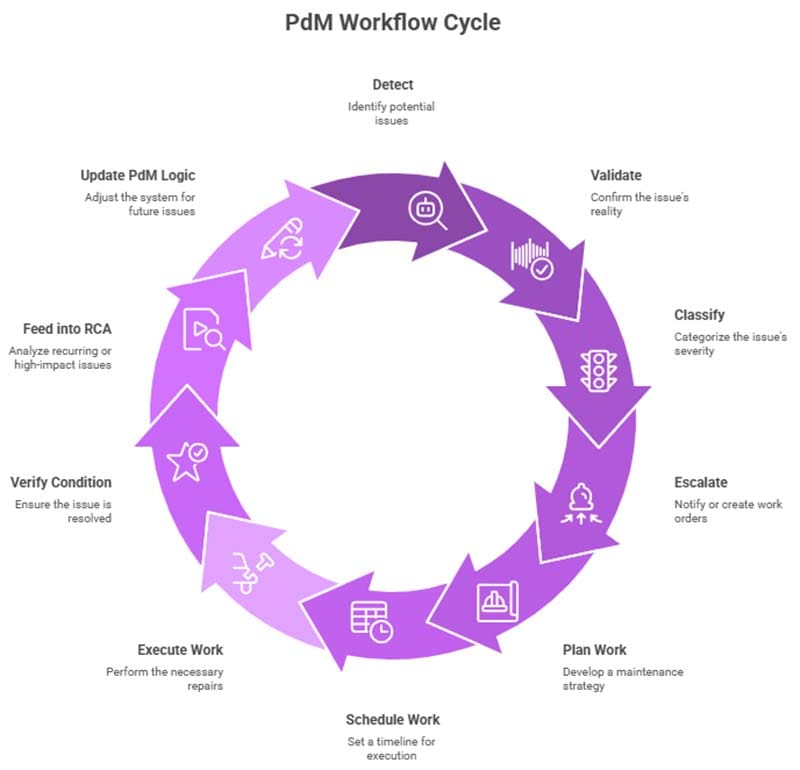
Detect
Validate (rule out noise/mounting issues/transients)
Classify severity
Escalate appropriately:
Trend/Warning: Notification
Alarm/Critical: Work Order
Plan the corrective work
Schedule it inside the P-F window
Execute the task
Verify condition post-repair
Feed into RCA if needed
Update PdM logic if the failure mode changes
This prevents slow response to real problems and ensures PdM is tied directly to work execution.
Principle 6: Implement PdM Governance to Prevent Strategy Drift
PdM degrades quickly without oversight. Governance must manage:
Alarm threshold changes
Route expansion
Technician repeatability
PdM-to-CMMS coding
Trend reporting cadence
RCA-to-PdM feedback loop
Signal Quality KPI
Signal quality should measure:
Measurement repeatability
Signal-to-noise ratio
Data completeness
Mounting integrity
Route compliance
Frequency-domain clarity
These KPIs prevent the slow drift toward unreliable data.
Principle 7: Use a Unified PdM Maturity Model
A scalable program evolves through predictable levels:
Level 1: Data collection
Level 2: Reliable detection
Level 3: Integrated planning and scheduling
Level 4: Predictive execution
Level 5: Multi-site standardization and governance
This model guides development and provides benchmarking consistency.
Principle 8: Integrate PdM With the CMMS Without Corrupting Data
Effective integration requires:
Notifications for early-stage conditions
Immediate Work Orders for Alarm and Critical findings
Evidence attached to every PdM-originated entry
Clear PdM work codes for reporting
Post-maintenance verification before closure
This ensures the CMMS reflects true equipment condition without noise or clutter.
Principle 9: Standardize What Must Be Standard—but Localize What Must Be Local
Standardize:
PdM techniques
Alarm logic
Asset-class detection rules
Workflows
CMMS coding structure
Decision criteria
KPIs
Localize:
Environmental load
Equipment age
Skills available
Failure history
Local resource constraints
Scalability requires both uniformity and flexibility.
Principle 10: Measure Conversion, Not Collection
The value of PdM is not in how much data you collect.
Key metrics:
% of PdM findings converted to completed work
% of interventions performed inside the P-F window
Repeat failure reduction
Emergency work reduction
Condition-monitoring coverage
Signal quality index
PdM only scales when it drives action, not just reporting.
Conclusion
A predictive maintenance strategy that scales across all asset classes is built on:
Failure-mode logic
Proper technique selection using industry standards
Asset-class frameworks
Detection rules that apply universally
Inspection frequencies tied to degradation rates
Strong governance
Clean CMMS integration
Maturity-based progression
KPIs that measure action, not data volume
When implemented correctly, PdM expands naturally from a small pilot to a plant-wide and enterprise-wide capability that measurably reduces failures and stabilizes operations.