Early Failure Detection: What Plants Get Wrong About the P-F Curve

Early failure detection should be straightforward. Every degradation mechanism creates detectable signals before breakdown. Yet plants still detect problems late because they misunderstand how failures actually progress along the P-F curve and how quickly the warning window can collapse.
Plants Misinterpret What the P-F Curve Actually Represents
The P-F curve is not a fixed timeline. Warning duration varies dramatically based on failure mode, operating conditions, and detection sensitivity.
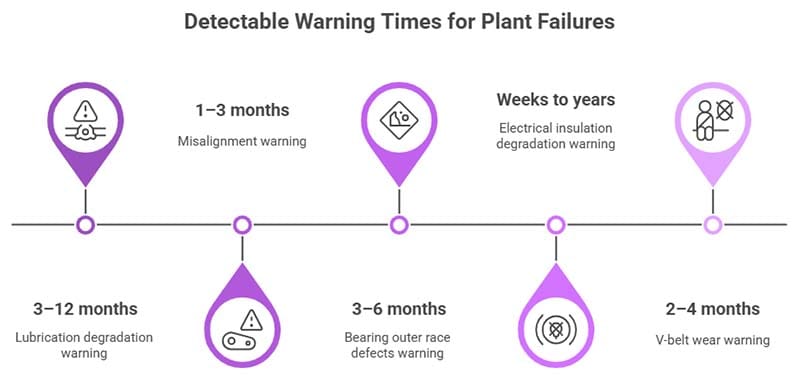
Typical ranges of detectable warning time:
Lubrication degradation: 3–12 months
Misalignment: 1–3 months
Bearing outer race defects: ~3–6 months of detectable warning (with proper high-frequency analysis)
Bearing inner race defects: often shorter (higher load cycles and more frequent impacts)
Cage failures: minimal warning in high-speed applications (sometimes hours); slower-speed cage wear may provide days to weeks via ultrasound
Electrical insulation degradation: weeks to years (highly dependent on voltage stress, thermal cycling, and contamination)
V-belt wear: 2–4 months
Key point:
The detectable portion of the P-F interval - not the total physical degradation period - determines how early a plant can reliably intervene.
Detection Tools Often Don’t Match the Failure Mode
Many programs rely on technologies that cannot see the earliest onset of specific failure mechanisms.
RMS vibration (Velocity, mm/s or in/s per ISO 10816/20816)
Intended for: unbalance, misalignment, looseness
Limitation: insensitive to early-stage bearing defects
Early bearing detection requires:
High-frequency acceleration enveloping (5–40 kHz)
gSE / Spike Energy / Kurtosis indicators
Infrared thermography
Reliable early indicator for:
Lubrication starvation
Load-induced friction
Electrical resistance issues
Less reliable early indicator for:
Structural looseness (unless friction or load produces localized heat)
Late indicator for:
Fatigue cracks
Many rolling-element defects
Ultrasound
Early detection of:
Friction
Lubrication-film breakdown
Turbulence
Mechanical contact changes
Often detects these issues earlier than both vibration and IR
ESA/MCSA (Motor Current Signature Analysis)
Strong for:
Broken rotor bars
Air gap eccentricity
Some bearing-related electrical signatures
Weak for:
Stator insulation degradation (requires IR/PI/PD testing)
The earliest warning signals appear only when the detection method matches the way the failure develops.
Most Plants Detect Much Closer to F Than They Realize
Detection often occurs deep into the degradation process, not near the P-point.
Common reasons:
Inspection or monitoring intervals exceed warning time
OEM alarm thresholds hide early patterns
Trending is too slow for rapid acceleration phases
CMMS logs capture discovery, not when the problem first became detectable
Late detection isn’t a technology failure; it’s a strategy failure.
Failure Progression Is Non-Linear
Most failures do not progress at a steady rate. The typical pattern is:
Long quiet phase
Weak detectable changes
Rapid acceleration
Failure
This is particularly true for fatigue-related mechanisms, which are often modeled using a Lognormal Distribution to capture the accelerating nature of damage progression.
Once the acceleration phase begins, the remaining P-F interval shrinks quickly - sometimes faster than the monitoring interval.
Route-Based Monitoring Is Too Slow for Many Failure Modes
Route-based monitoring often fails because the inspection interval exceeds the early-warning window.
Example:
If the P-F interval is ~12 days and inspections occur every 30 days:
Many failures will progress to functional failure between inspections
Detection becomes inconsistent and unreliable
Plants default to reactive behavior
Unplanned downtime rises
This does not mean detection is impossible; only that the risk is unacceptably high.
Fast-progressing failures require:
Wireless vibration sensors
Continuous ultrasound or HF detection
More frequent oil sampling on high-risk systems
Inspection frequency must reflect failure behavior; not staffing or PM calendar traditions.
No Single Technology Provides True Early Warning
A mature program uses overlapping technologies to reveal weak signals earlier:
Ultrasound: friction, lubrication-film collapse, turbulence
High-frequency vibration: early bearing defect detection
Oil analysis: wear debris, contamination, oxidation
Thermography: load, resistance, lubrication breakdown
ESA/MCSA: rotor bars, eccentricity, electrical imbalances
Continuous sensors: short-warning or high-consequence assets
Early warnings are almost always a pattern, not a single indicator.
Continuous Monitoring Requires Economic Justification
Continuous sensing is powerful but expensive. Plants must weigh:
Sensor cost
Network/switching infrastructure
Data storage
Analytics/AI platforms
Alarming and triage labor
It is worthwhile when:
The P-F interval is short
The consequence of failure is high
Asset is a production bottleneck
Failure patterns accelerate quickly
For long P-F intervals or low-impact assets, periodic inspection is often sufficient and cost-effective.
What Plants Should Do Instead
A more reliable, technically aligned approach:
Identify dominant failure modes per asset (ISO 14224, SAE JA1011/1012)
Estimate P-F intervals, including detectable warning time
Match detection methods to the earliest detectable indicators (ISO 17359)
Set inspection frequency to ~½ to ⅓ of the P-F interval
For critical assets: use ¼ to ⅕
Goal: ensure at least two detection opportunities before functional failure
Use continuous monitoring where risk and economics justify
Customize alarm thresholds for early-stage sensitivity
Define clear response triggers based on condition severity
Track late detections as a leading KPI to strengthen program discipline
Early detection succeeds when interval, method, and failure behavior are aligned—not when any single element is optimized in isolation.